
The average U.S. dental practice collects somewhere between 91% and 95% of what it’s actually owed. Top-performing practices sit at 98% or higher. That gap, three to seven points, translates into real money: on a practice collecting $1 million a year, it’s the difference between $30,000 and $70,000 in revenue that was contractually earned and never actually collected. The metric that reveals exactly where a practice falls on that range is net collection rate, and most owners have never sat down and calculated their own.
What Is Net Collection Rate in Dental Billing?
Net collection rate, or NCR, measures how much of the revenue a dental practice is genuinely entitled to collect, after contracted insurance write-offs, it actually receives. It’s the number that reflects real financial performance, separate from how busy the schedule looked or how much dentistry got produced.
Net Collection Rate Formula for Dental Practices
Net Collection Rate = (Total Payments Received ÷ (Total Production − Contractual Adjustments)) × 100

Here’s the formula run against a real example. Say a practice bills $500,000 at full fee, has $220,000 in contractual write-offs from PPO participation, and collects $273,000.
Gross collection rate on this same practice, payments divided by the full $500,000 billed, comes out to a discouraging-looking 55%. Run the net collection rate instead: $273,000 ÷ ($500,000 − $220,000) = $273,000 ÷ $280,000 = 97.5%.
That’s the same practice, the same collected dollars, and two wildly different-looking numbers. The gross figure makes it look like a struggling office. The net figure shows a practice performing above the industry benchmark. This is exactly why PPO-heavy dental practices should never evaluate themselves on gross collection rate alone, it’s measuring against a fee schedule no in-network payer was ever going to fully pay.
What’s a Good Net Collection Rate for a Dental Practice in 2026?
Current benchmarks: net collection above 96% is where high-performing dental practices sit today. The broader industry average runs 91-95%. Anything below 90% is generally treated as a signal of real, structural revenue cycle management services, not just normal variation. This usually travels alongside other slipping numbers too, denial rates above 3%, clean claim rates below 97%, or A/R aged past 90 days creeping above 10% of total receivables.
It’s worth calculating this on a rolling 12-month basis rather than any single month. Dental practices see genuine seasonal swings, a slower January looks very different from a strong Q4, and a rolling average keeps the number honest rather than reactive to normal monthly noise.
Run the Numbers on Your Own Practice
Doing this calculation by hand takes three figures pulled from your practice management system and a few minutes. We’re building a free RCM calculator that does it instantly; enter your production, contractual adjustments, and total payments, and get your exact NCR benchmarked against current industry standards.
One Mistake That Skews the NCR Calculation
Bad debt and charity care write-offs should never be subtracted from the denominator the way contractual adjustments are. Only the negotiated difference between your fee and a payer’s contracted rate belongs in that subtraction. Pulling out bad debt too makes the number look artificially healthy and buries real collection failures that deserve investigation instead of quiet removal from the math.
Why a Busy Practice Can Still Have a Low Net Collection Rate
A full schedule and strong production numbers don’t guarantee strong collections. Three specific problems tend to show up as a declining NCR well before they show up anywhere else on a practice’s dashboard:
Coordination of benefits sequencing errors
A claim billed to the wrong primary insurer gets delayed, reduced, or denied until the sequencing is corrected, and every one of those outcomes drags collections down relative to production.
Unmatched or misapplied payments
A payment posted to the wrong claim makes one account look paid while the correct one still shows outstanding, feeding a distorted number into the NCR calculation.
Underpayments that never get caught
A claim marked paid that was actually paid below the contracted rate still counts as collected in a naive calculation, but it’s revenue the practice was owed and never actually received.
How to Check NCR by Payer, Not Just Overall
A single blended NCR across your whole payer mix can hide a real problem. Calculate it separately for each major payer. If one insurer’s NCR consistently runs below the others, that’s rarely coincidence; it usually points to that specific payer underpaying claims, processing slowly, or denying more than your contract should allow. A blended average will never surface that pattern on its own.
Steps to Improve Net Collection Rate
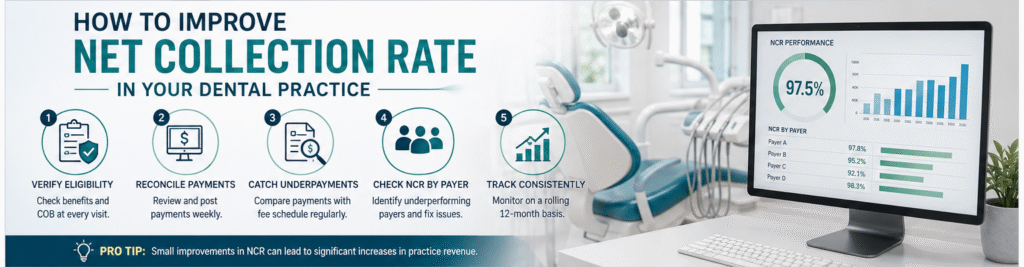
- Verify coordination of benefits and eligibility at every visit, not just the first one, to reduce sequencing-related denials and delays.
- Reconcile payment posting weekly so misapplied payments get caught before they distort your numbers.
- Compare posted payments against your current fee schedule on a recurring basis, so underpayments get caught while they’re still recoverable.
- Calculate NCR by payer, not just as a single overall figure, to catch payer-specific problems a blended number would hide.
- Track NCR on a rolling 12-month basis so a genuine decline gets caught early, while it’s still a small, fixable problem.
How CEC Supports Net Collection Rate
NCR reflects everything happening upstream in the revenue cycle: intake accuracy, coordination of benefits, payment posting, and underpayment recovery. That’s why CEC treats it as the outcome of the full billing process rather than an isolated number to chase in a vacuum. Through CEC’s Accounts Receivable Management Services, collections get tracked against what’s genuinely owed, and when a practice’s NCR starts to slip, the cause gets investigated specifically rather than left as an unexplained dip.
Get a Free Net Collection Rate Review
Find out your practice’s real NCR, by payer, not just as a blended number. Our experts will pull your production, adjustments, and payment data, benchmark it against industry standards, and flag exactly where collections are slipping.
Get a Free Net Collection Rate Review →The Bottom Line
Net collection rate is the number that tells the truth a production report can’t. Calculate it on a rolling basis, break it down by payer, and investigate the moment it starts to slide rather than waiting for a full quarter to confirm the trend. If you don’t currently know your own practice’s NCR, that’s worth finding out this month. Contact CEC to have your collections data reviewed, or do a quick self-check on our free RCM calculator to run the numbers yourself.
FAQs
What’s the difference between gross collection rate and net collection rate for a dental practice?
Gross collection rate compares payments against total production before contractual adjustments, which makes a PPO-heavy practice look artificially weak even when it’s collecting nearly everything it’s owed. Net collection rate compares payments against production minus those adjustments, giving a far more accurate read on real collection performance.
What is considered a good net collection rate in dental billing?
Current benchmarks put high-performing dental practices at 96% or above, with the broader industry average running 91-95%. Anything below 90% typically signals real revenue cycle problems worth investigating, rather than normal month-to-month variation.
Should bad debt write-offs be subtracted when calculating dental NCR?
No. Only contractual adjustments, the negotiated write-off tied to a payer contract, belong in the denominator. Subtracting bad debt or charity care write-offs too inflates the number artificially and hides real collection failures that should be reviewed rather than removed from the math.
How often should a dental practice calculate net collection rate?
On a rolling 12-month basis rather than a single month or quarter. Dental practices see real seasonal variation, and a rolling average reflects the genuine trend instead of reacting to normal swings that don’t represent an actual change in performance.
Can a fully booked dental practice still have a low net collection rate?
Yes, and this is exactly why production alone is a misleading measure of financial health. A practice can be busy every day and still be losing revenue to coordination of benefits errors, misapplied payments, or uncaught underpayments, none of which show up in a production report but all of which quietly pull NCR down.
Why does net collection rate vary so much between individual insurance payers?
Because payers differ in how they process, underpay, or deny claims. Calculating NCR separately for each major payer, rather than relying on one blended number, is the only way to catch a specific payer that’s consistently underperforming the rest of your book.